Hyperplasia vs. Hypertrophy
Yuval's Zoo Animals
Cell size vs life span vs animal size (acinar)
| Metrics | Correlation | Partial Correlations |
|---|---|---|
| Cell size vs animal size | r = -0.7002533021, p = 0.00009729634587 | r = -0.5426265316, (controlling for life span), p = 0.006150738805 |
| Animal size vs life span | r = 0.684339349, p = 0.0001614612579 | r = 0.2024331554, (controlling for cell size), p = 0.3428006082 |
| Cell size vs life span | r = -0.878788851, p = 7.547746985e-9 | r = -0.7676132969, (controlling for animal size), p = 0.00001197751058 |
Cell Size (acinar) vs Animal Size

Animal Size vs Life Span

Cell Size (acinar) vs Life Span

Cell Size (acinar) vs Life Span

Animal Size vs Life Span

Partial Correlation Plot

Cell size vs life span vs animal size (hepatocyte)
| Metrics | Correlation | Partial Correlations |
|---|---|---|
| Cell size vs animal size | r = -0.5150977425, p = 0.02401304198 | r = -0.1664690938, (controlling for life span), p = 0.5091283061 |
| Animal size vs life span | r = 0.6763928687, p = 0.001473722838 | r = 0.5191833445, (controlling for cell size), p = 0.02724661683 |
| Cell size vs life span | r = -0.6784589086, p = 0.001406813295 | r = -0.5228004846, (controlling for animal size), p = 0.0260081398 |
Cell Size (hepatocyte) vs Animal Size

Animal Size vs Life Span
Cell Size (hepatocyte) vs Life Span

Cell Size (hepatocyte) vs Life Span

Animal Size vs Life Span
Partial Correlation Plot

Growth rate to weaning in doubles per day (acinar)
| Metrics | Correlation | Partial Correlations |
|---|---|---|
| Growth rate vs animal size | r = -0.7679227203, p = 0.0005130149458 |
r = -0.411083617, (controlling for life span), p = 0.1279517205 r = -0.4050829643, (controlling for cell size), p = 0.1341698913 r = -0.3543570507, (controlling for life span and cell size), p = 0.2138320819 |
| Growth rate vs life span | r = -0.8576811812, p = 0.00002158333402 |
r = -0.6815563708, (controlling for animal size), p = 0.005139431385 r = -0.516488049, (controlling for cell size), p = 0.0487015874 r = -0.4826677073, (controlling for animal size and cell size), p = 0.08044460089 |
| Growth rate vs cell size | r = 0.8143182096, p = 0.0001229621367 |
r = 0.2562818419, (controlling for life span), p = 0.3565304514 r = 0.5600451944, (controlling for animal size), p = 0.02991404218 r = 0.1298521517, (controlling for life span and animal size), p = 0.6581671443 |
Growth Rate vs Animal Size

Growth Rate vs Life Span

Growth Rate vs Cell Size (acinar)

Growth rate to weaning in doubles per day (hepatocyte)
| Metrics | Correlation | Partial Correlations |
|---|---|---|
| Growth rate vs animal size | r = -0.8452519004, p = 0.0002742024726 |
r = -0.397745952, (controlling for life span), p = 0.2003909082 r = -0.720293294, (controlling for cell size), p = 0.008237977873 r = -0.39215786, (controlling for life span and cell size), p = 0.232916163 |
| Growth rate vs life span | r = -0.8881745494, p = 0.00005006245753 |
r = -0.6144447809, (controlling for animal size), p = 0.03351582344 r = -0.7716778872, (controlling for cell size), p = 0.003282169238 r = -0.5372260295, (controlling for animal size and cell size), p = 0.0883423495 |
| Growth rate vs cell size | r = 0.694717869, p = 0.008404299298 |
r = -0.09396094843, (controlling for life span), p = 0.7714683996 r = 0.3580325645, (controlling for animal size), p = 0.2531582753 r = -0.06026069149, (controlling for life span and animal size), p = 0.8602932612 |
Growth Rate vs Animal Size
Growth Rate vs Life Span
Growth Rate vs Cell Size (hepatocyte)

Metabolic Rate (acinar)
| Metrics | Correlation | Partial Correlations |
|---|---|---|
| Metabolic Rate Vs Animal Size | r = -0.9467988929, p = 2.917304234e-7 |
r = -0.8724910034, (controlling for life span), p = 0.0000998664967 r = -0.8381817888, (controlling for cell size), p = 0.0003455882631 r = -0.8353735306, (controlling for life span and cell size), p = 0.0007173183685 |
| Metabolic Rate Vs Life Span | r = -0.807739334, p = 0.0004751701012 |
r = -0.4458614192, (controlling for animal size), p = 0.1267527563 r = -0.1613601294, (controlling for cell size), p = 0.5984414345 r = -0.1031907431, (controlling for animal size and cell size), p = 0.7496251197 |
| Metabolic Rate Vs Cell Size | r = 0.8660168759, p = 0.00006218993618 |
r = 0.5310128773, (controlling for animal size), p = 0.06186770498 r = 0.5471573102, (controlling for life span), p = 0.05295746711 r = 0.336695603, (controlling for animal size and life span), p = 0.284552059 |
Metabolic Rate vs Animal Size

Metabolic Rate vs Life Span

Metabolic Rate vs Cell Size (acinar)

Metabolic Rate (hepatocyte)
| Metrics | Correlation | Partial Correlations |
|---|---|---|
| Metabolic Rate Vs Animal Size | r = -0.9658254725, p = 0.000005726187305 |
r = -0.8582085214, (controlling for life span), p = 0.003068133259 r = -0.9673720023, (controlling for cell size), p = 0.00002000994161 r = -0.9125053654, (controlling for life span and cell size), p = 0.001566537331 |
| Metabolic Rate Vs Life Span | r = -0.864110963, p = 0.001262058093 |
r = -0.08082927904, (controlling for animal size), p = 0.8362298208 r = -0.8555403038, (controlling for cell size), p = 0.00326606641 r = -0.548858879, (controlling for animal size and cell size), p = 0.1588883887 |
| Metabolic Rate Vs Cell Size | r = 0.5112055855, p = 0.1310033379 |
r = -0.542405717, (controlling for animal size), p = 0.1313570606 r = -0.467282518, (controlling for life span), p = 0.2047080348 r = -0.7096329617, (controlling for animal size and life span), p = 0.04864956641 |
Metabolic Rate vs Animal Size
Metabolic Rate vs Life Span
Metabolic Rate vs Cell Size (hepatocyte)

Acinar Cell Size vs Hepatocyte Cell Size
Acinar Cell Size vs Hepatocyte Cell Size

Animals Samples
Tiger

Fruit bat

Human

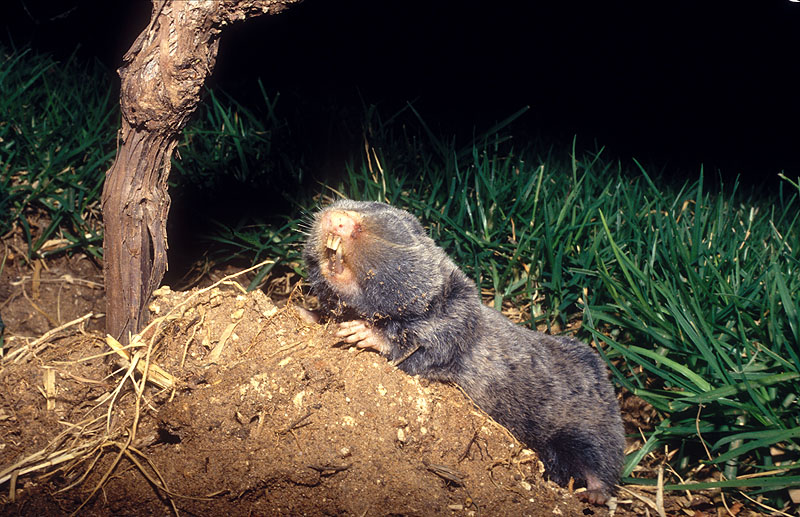
Palestine blind mole rat
Wild bore

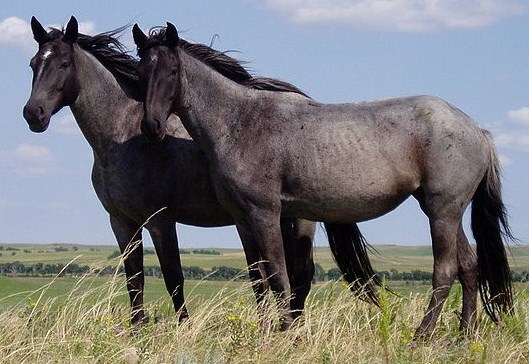
Horse
Grey wolf

Human
Giraffe

Cow

Cat

Cotton tamarin

Kangaroo

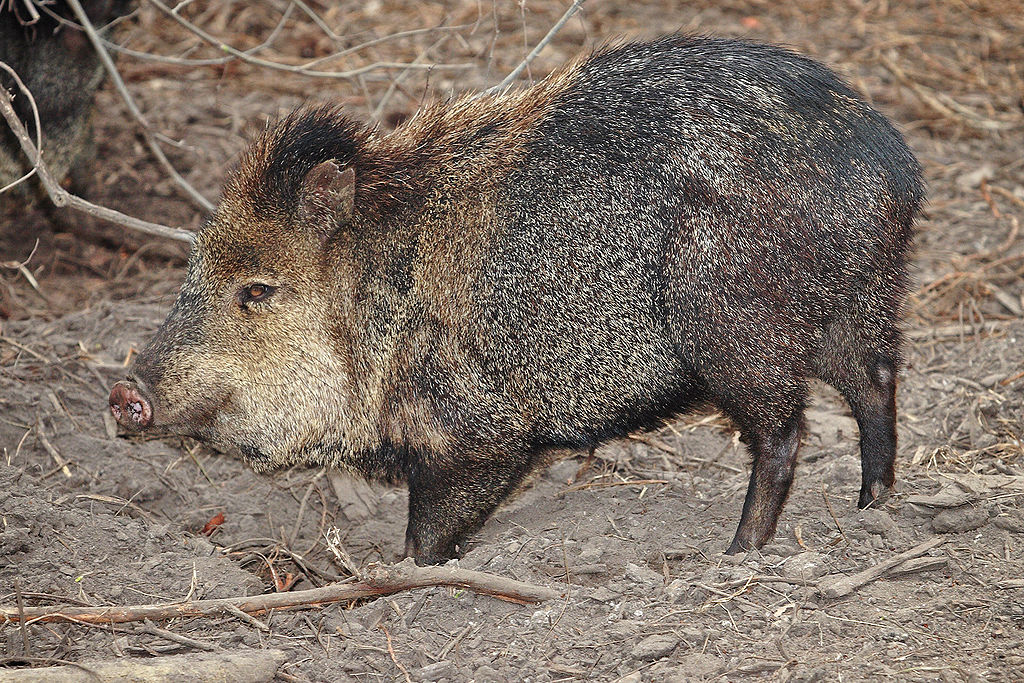
Collared peccary
pig

Dog

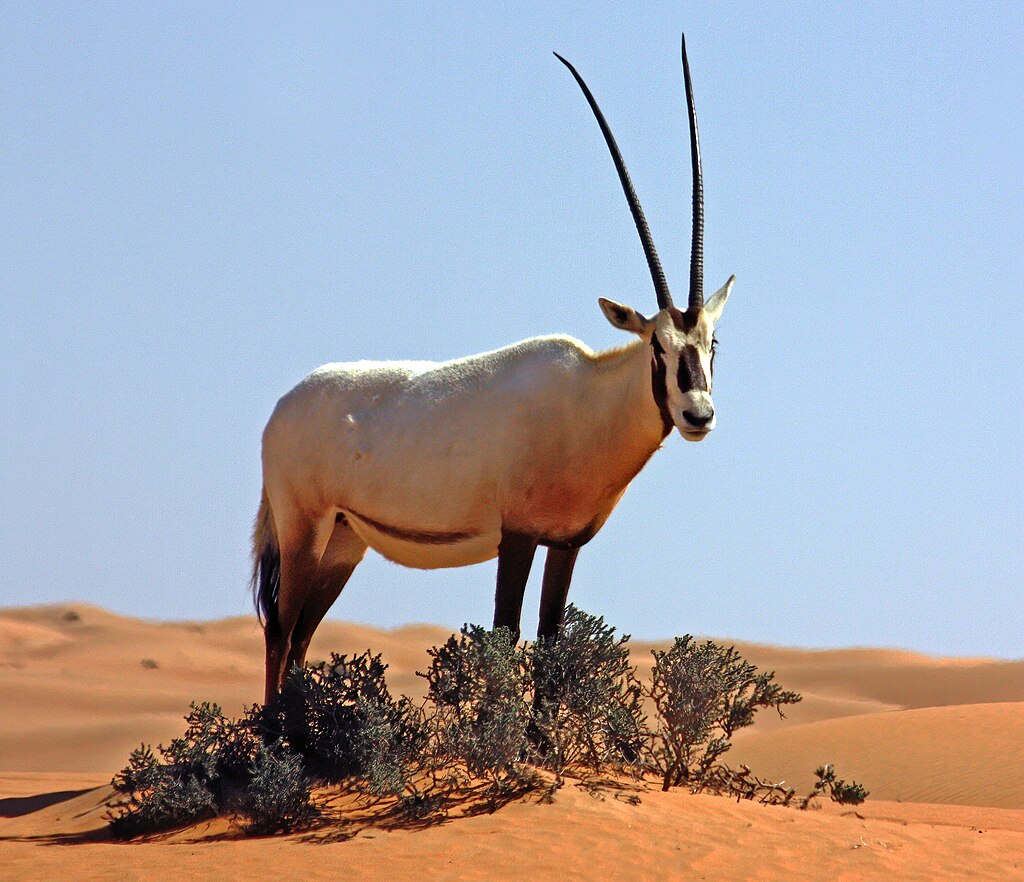
Arabian oryx
naked mole rat

Black-tailed prairie dog

Israeli gazelle

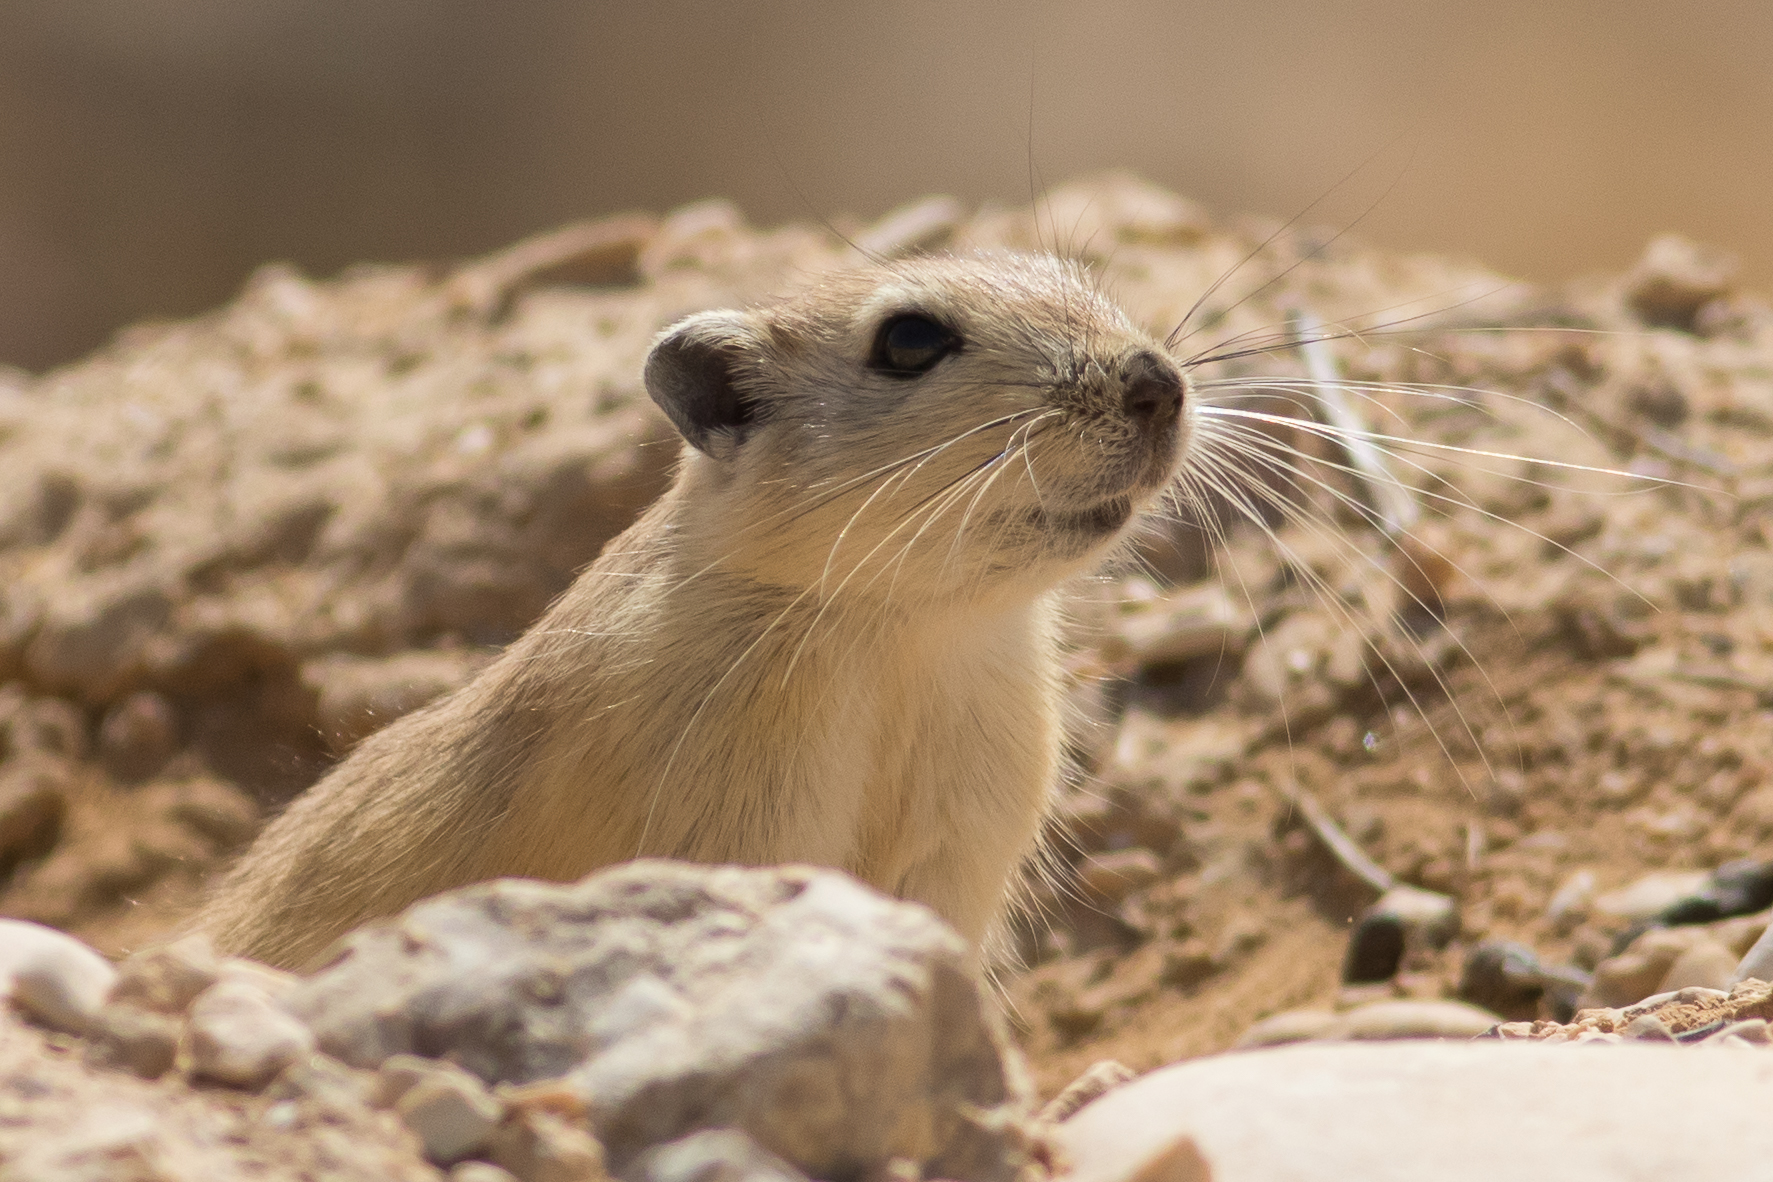
Sand rat
Black rat

Mouse

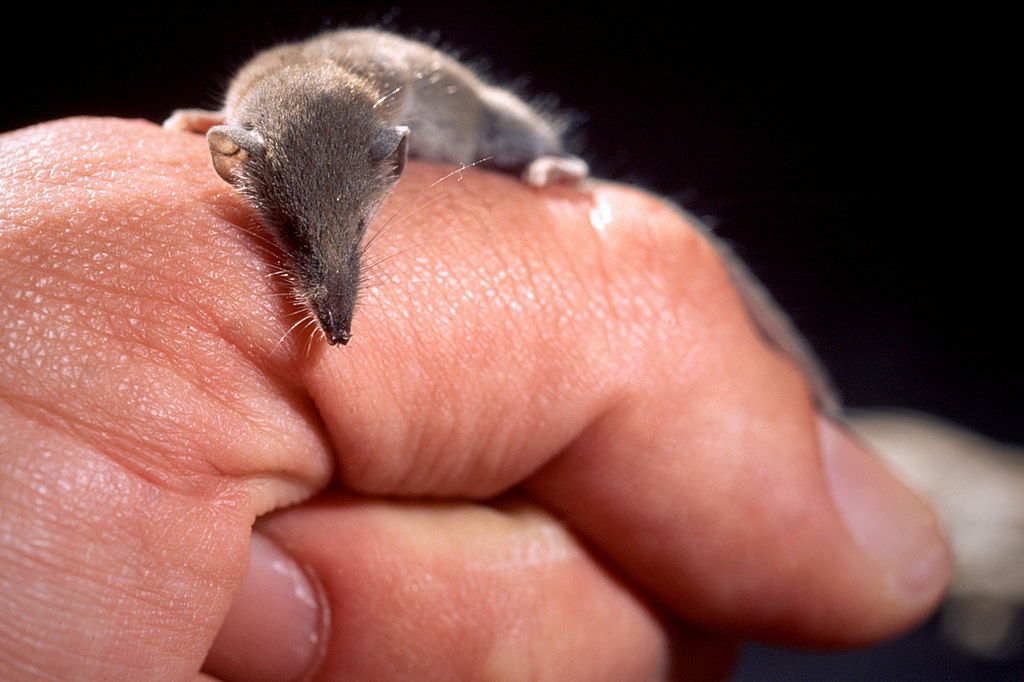
Etruscan shrew
Human
Indian crested porcupine

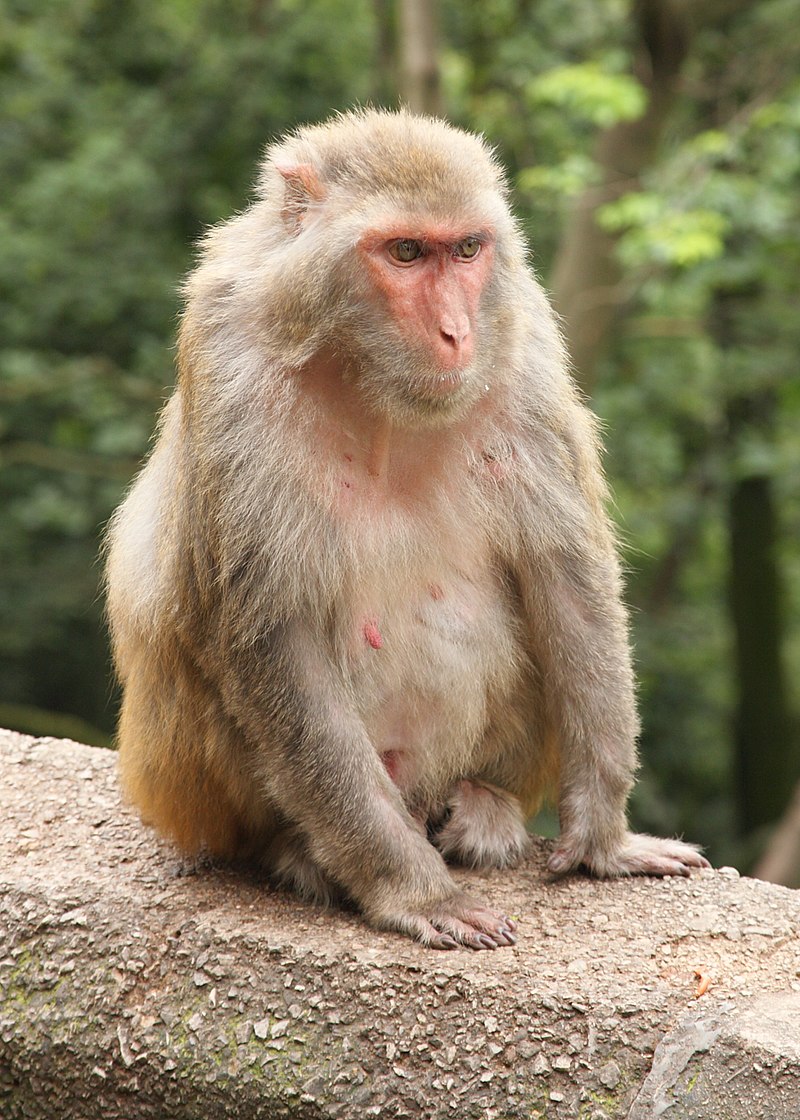
Rhesus macaque
Red-mantle saddle-back tamarin

Grey long-eared bat
